“It’s the total experience that matters. And that starts from when you first hear about a product [or service]… experience is more based upon memory than reality. If your memory of the product [or service] is wonderful, you will excuse all sorts of incidental things.” -Dr. Donald Norman, interview from 2008
The 21st century has been coined the “experience economy” by researchers like Joseph Pine and James Gilmore; one in which your customer experience can make or break your company. Organizations need to orchestrate a memorable journey for their customers, and the memory of the experience itself becomes the product. Customers will remember how the experience made them feel, and that feeling will keep them coming back.
I believe one secret key to modern-day innovation is intentionally designing products and services around the experiences people actually have with them — paying close attention to the touchpoints and interactions people encounter and emotions they feel. The best place to start is by understanding, deeply, how individuals currently experience a specific situation “as-is.” Only by first seeing how things are now, can you find innovative opportunities to make these situations better for those you are striving to serve.
In this post, I’ll walk through Experience Diagramming step by step, with examples from a complex transportation project that I led in 2019. I’ll include suggestions for using additional methods from the LUMA System. Detailed information about the LUMA System is available on LUMA Workplace, our subscription platform for learning and applying design thinking. If you are already using LUMA Workplace, just log in to follow the links in this article. If you do not have an account, you are welcome to start a LUMA Workplace trial account, which gives you access to everything at no cost for 30 days.
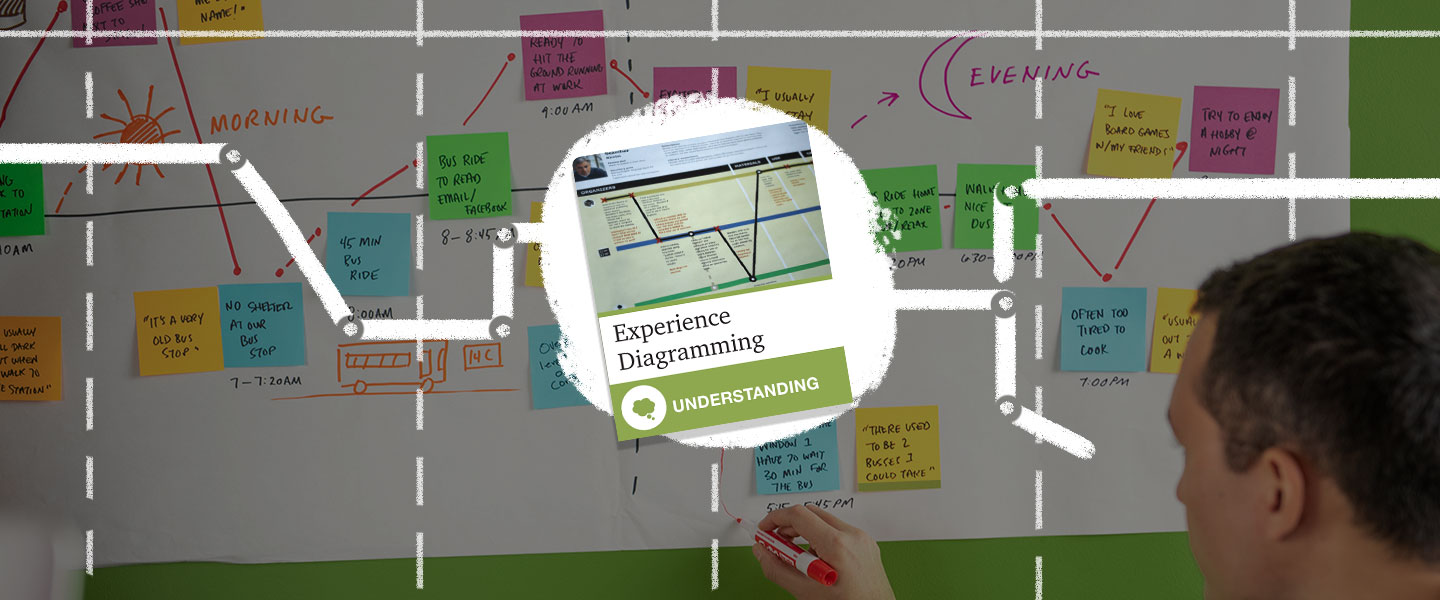
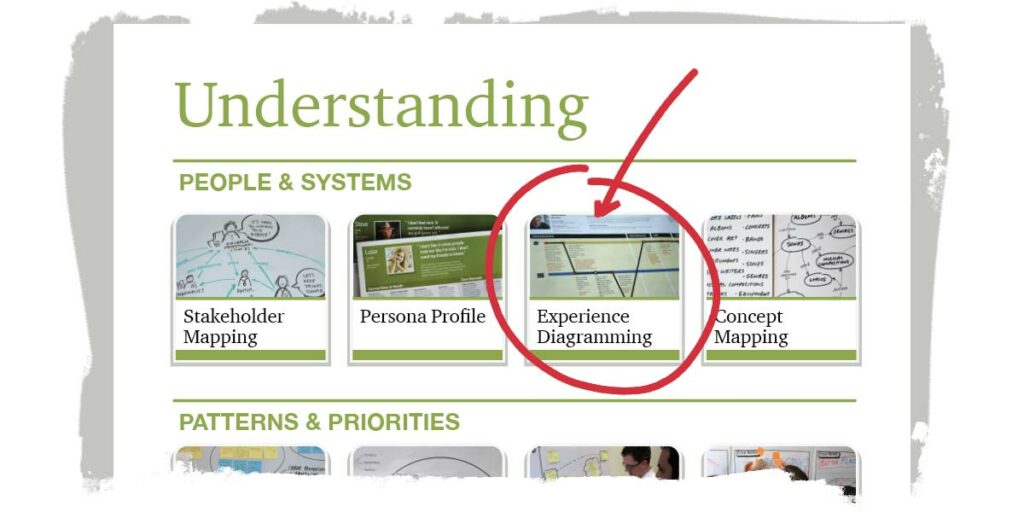
Now let’s get started talking about Experience Diagramming. It is one of the 36 human-centered design methods in the LUMA’s System of Innovation, and falls within the Understanding skill set for analyzing challenges and opportunities. It is a powerful method that you can use to understand the current state of any situation. This technique maps a person’s journey through a set of circumstances or tasks so you can understand what that individual actually is experiencing.
Almost always, Experience Diagramming produces energizing moments of clarity because you truly understand — and ideally, empathize with — what someone is experiencing and feeling. Those insights empower you to develop a better experience because you’re now able to work from that person’s point of view.
In practice, Experience Diagramming is a flexible and dynamic method that allows you to change the format you use to document the experience based on each unique situation. A few types of formats you might consider are:
- time-based, which records everything that happens between a starting point and stopping point
- emotional attributes, which focuses on what people feel and how they react
- physical mapping, which shows where people went and in what sequence
- interaction, which captures interactions between people, places, and things
Because of the wide variety of formats, Experience Diagramming is known by different names including user journey maps, service blueprints and activity diagrams. At LUMA, we use the name Experience Diagramming because it encompasses all of these other types of tools.
Experience Diagramming is a method that can be used at any time during a project. I always encourage people to create at least one diagram early in a project to serve as a baseline of how you understand the experience at the start of your work. As you continue learning, you can revisit and update your Experience Diagram so it evolves as you gain new knowledge or as circumstances change.
To help explain how Experience Diagramming works, I’ll share a specific example of how I used this method in practice. In 2019, I worked with an organization in Singapore that was focused on the future of local transportation for the island nation, which is small in area (about 726 square kilometers), and densely populated (approximately 5.7 million people). Our goal was to propose innovative transportation ideas for the country. My team used Experience Diagramming to ensure that we fully understood the experiences of business commuters traveling to and from work to help us determine how we might improve these experiences.
When I use Experience Diagramming, I usually break down the method into two main phases:
- Phase 1 — gather information and document the current state of a situation.
- Phase 2 — analyze and make sense of the information to draw out insights and opportunities for innovative and creative solutions.
Phase 1: Gather information and document the current state of the situation
Step 1: Decide on the experience(s) to document
In this first step, you might determine if there is one experience or multiple experiences you want to document. To ensure you have a breadth of perspectives, you might try documenting the same experience(s) from the perspectives of multiple people.
For the transportation project in Singapore, we wanted to understand how three specific types of people would travel to work. We already created Persona Profiles (another method in the LUMA System) for these three types of business commuters:
- Commuters who use public transportation
- Commuters who use taxis and/or ride sharing options
- Commuters who use their own personal vehicle
We decided to use a time-based format for each of these three personas, for the time period from when they prepared to leave their home until they arrived at their office, and then again from when they prepared to leave their office until they arrived home.
Step 2: Collect information about the current situation(s)
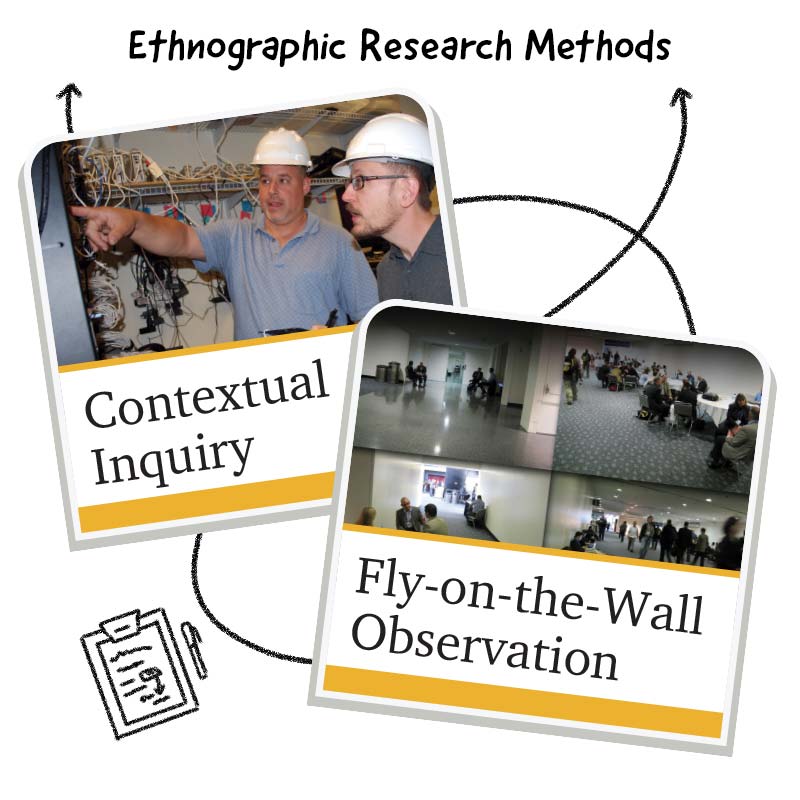
To document the situations as objectively and accurately as possible, you need to have correct and detailed information from people who directly experience it. To get that, you will either need to collaborate with individuals who have first-hand experience or you will need to collect information about their experiences, which you can do using one or more ethnographic research methods.
For the transportation project in Singapore, we used two different ethnographic research methods to ensure we understood the different experiences for the business commuters. First, we conducted a Contextual Inquiry with our three types of commuters. We rode with the commuters to/from work in all three situations (public transportation, taxis/ride sharing, personal vehicle) and documented their process, asking questions as we traveled. Second, we conducted Fly-on-the-Wall Observation of the commuters. We went to bus and train terminals, taxi stands, apartment complexes, and parking lots to observe how they interacted with the spaces and places around them during their morning and evening commutes.
Step 3: Determine the format(s) for documenting the experience(s)
As you collect information, you will begin building your experience diagram as a picture of what you’re learning. There are multiple ways to visualize an experience diagram. You can see four different experience diagram formats here: 1) 24-hour clock, 2) emotional attributes, 3) physical map, and 4) people, places. Depending on your project and the context, you might use one or more of these formats.
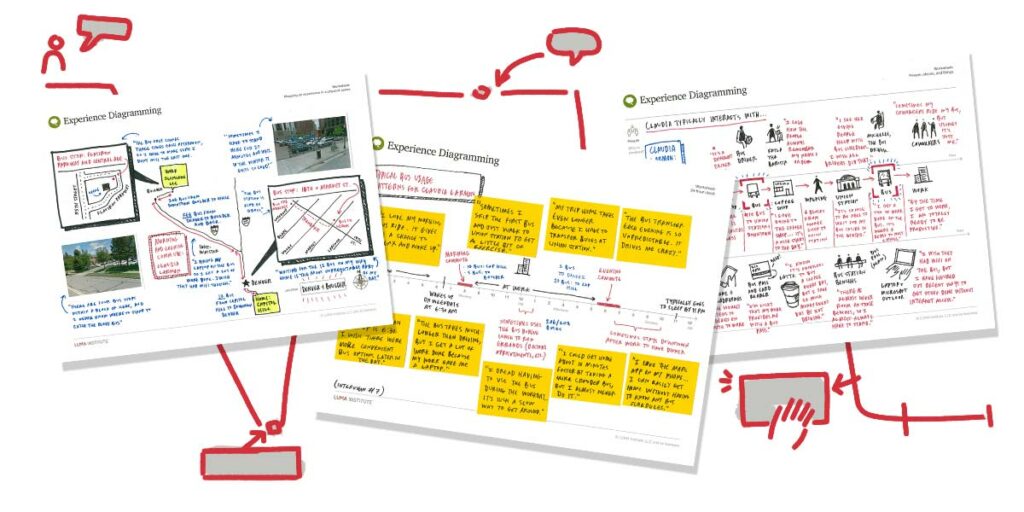
For the transportation project in Singapore, my team created several visual variations of an experience diagram:
- First, we first mapped the three different types of commuters’ movements along the 24-hour clock template, paying specific attention to the morning and evening commute periods of time.
- Next, we created physical maps to display the locations throughout the commuters’ daily journey commuting, calling out important details, such as where they purchased public transit tickets and their walking path between the train and office. We added pictures from the Contextual Inquiry and Fly-on-the-Wall observations to these experience diagram maps.
- Lastly, we overlaid details and interactions related to people, places and things. An example of this is how the commuter (person) uses a ticket kiosk (thing) at the entrance of the train station (place) to buy a ticket.
The experience diagrams from LUMA Workplace template are very similar in style to those created by the Singapore project team.
Step 4: Document the experience
To document the experiences, it is important to establish starting and ending points for the diagrams to keep a tight focus on the experience you’ve chosen. You will also want to think about the different stages or phases throughout the experience. A key thing I have learned is that experiences often start earlier than you think and extend further into time than you initially understood. When setting the parameters for an experience diagram, I like to think of the 5E model framework: 1) Entice, 2) Enter, 3) Engage, 4) Exit and 5) Extend.
When documenting the experience in people, places and things format, I also like to use the organizational framework called AEIOU: Activities, Environments, Interactions, Objects, and Users. This helps me to ensure that everything I collected during Contextual Inquiries and Fly-On-The-Wall Observations is accounted for in the diagrams, so we can create a powerful visualization of all of our information and observations.
Phase 2: Analyze your experience diagram(s) for insights and opportunities
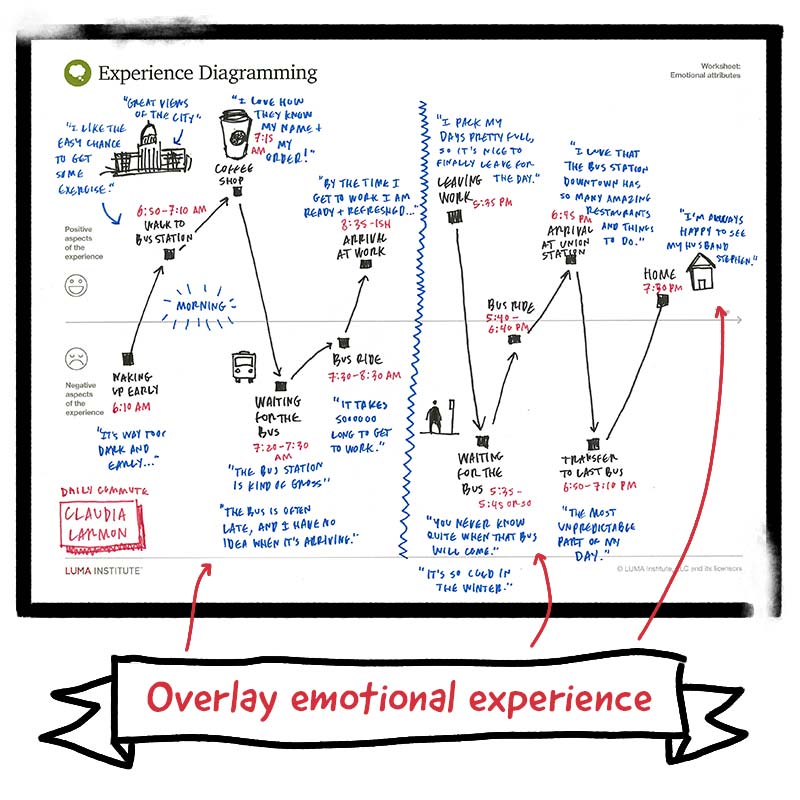
Step 1: Overlay emotional experience
After documenting the experience in as many formats as needed (i.e. time-based, map, interactions), I then overlay the emotions and reactions of the individuals in the situations we researched. To develop innovative and creative solutions, you likely will want to find ways to enhance positive emotions that the experience evokes, such as joy and happiness, and remove negative emotions, such as frustration. Note that you can map emotional attributes earlier. This is just how I went about the process in my own work.
For the transportation project in Singapore, we found that commuters enjoyed using time during their commute for personal and professional growth. They listened to podcasts, read books or caught up on emails. We also found that commuters did not like to wait, regardless of their mode of transportation, because they felt like their time wasn’t being valued. In addition, our commuters described the environments for public transportation as rather bleak and uninviting. Our project team carefully considered these emotional insights as we started thinking about the future of transportation in Singapore.
Step 2: Critically look at the steps, interaction points, and overall journey
The next step to analyzing your experience diagram is identifying the essential paths that have emerged, while also taking a critical look at all steps in the journey. By considering the journey as a whole, you may find that you can add/remove a step along the way to make the experience more efficient, more delightful — or both.
For the transportation project in Singapore, we identified some critical waypoints along the commute for the three different personas, such as when they ordered a ride and paid for their transportation — all critical points to be considered in future transportation ideas. Additionally, we found possible opportunities to remove steps, such as commuters needing to scan their train ticket, in favor of other ways to track people coming and going on public transportation without physically scanning something.
I often use two additional design thinking methods during this stage of analysis: Heuristic Review and Rose, Thorn, Bud. Heuristic Review can be used to analyze any situation based on experiential knowledge of how something works best. Rose, Thorn, Bud allows you to color-code an experience around its positives, negatives and opportunities. Both methods can help guide you to analyze a situation and identify insights.
Step 3: Hone in on areas to improve
After you’ve used a few techniques to analyze patterns of behavior, find opportunities and identify insights, your next step is to hone in on areas of the experience to improve or re-imagine. These areas might be obvious, like improving pain points on a customer’s journey, or they might be more nuanced and subtle as they emerge from your analysis.
For the transportation project in Singapore, we used our experience diagrams to determine specific areas to improve. For example, we recommended re-thinking how commuters would track and pay for their journey. Instead of scanning tickets, our analysis suggested there could be more innovative approaches that would both improve efficiency and enhance the commuters’ experiences.
Now that you understand the problem better, you can focus on solving it. At this point, I often use another design thinking method — Alternative Worlds — to help me envision the experience through new eyes. On this project in Singapore, we used Alternative Worlds and asked ourselves “If we were Starbucks, how might we design the transportation experience?” This alternative point of view allowed us to consider bold ideas like envisioning train stations as places to visit instead of places just to pass through.
—
Innovation starts with understanding the world around you, and then finding opportunities to improve it. In our modern-day experience economy, organizations must design with the experience as the center stage in order to stay competitive. Experience Diagramming is one of the best ways to get started; it can unlock insights about your current offerings by helping you understand how things are so that you can find opportunities for how they could be.